Neuroscope is a visual debugger for convolutional neural networks. The software is an interactive tool with a graphical user interface intended for interactive use by data scientists on the application level.
The purpose of the Neuroscope software is to allow data scientists to gain insight in the inner workings of a neural network, in the case of a system malfunction or misbehavior. The approach taken by Neuroscope is a network visualization approach, which means that the weights of the inner layers are visualized in a human interpretable way, which is helpful for understanding why a certain misbehavior occurred. In the context of COGNITWIN, the Neuroscope software will be useful as part of a software toolbox to make machine learning technology practically useable.
The software supports the following major features: (1) visualization of network architectures loaded from PyTorch or TensorFlow files as graph representation, visualization of trained weights by means of (2) activation maps, (3) saliency map, (4) guided back propagation, (5) grad-CAM, (6) guided Grad-CAM, and (7) grad-CAM plus.
The software supports arbitrary networks architectures for classification and semantic segmentation of image-like data and is currently being extended to multi-object detection and localization architectures.
Neuroscope is comparable to systems like Tensorboard. The major difference is the support of exchangeable machine learning backends (TensorFlow and PyTorch), and the interactive use via a graphical user interface.
The example synthetic image of billet rolling process illustrates the capability of Neuroscope to analyze a given neural network (top left). The task is to segment the image regarding the class “billet” as a component of automatic optical detection and tracking process. Using a saliency metric, a diffuse image of pixels sensitive to the class “billet” is computed (top right). The second visualization method called guided Grad-CAM shows clear regions of high activation in places of billets, as well as some localized areas of low activation (bottom left). The activation map computed by Guided Backpropagation method (bottom right) highlights pixels of high activation exactly at billet locations. The analysis of these 3 types of visualization maps raises the question: why the activation maps don’t show high activated pixels monotonously within the bounds of billets. This observation could be the indicator of a poorly trained deep learning model or scarce training data.
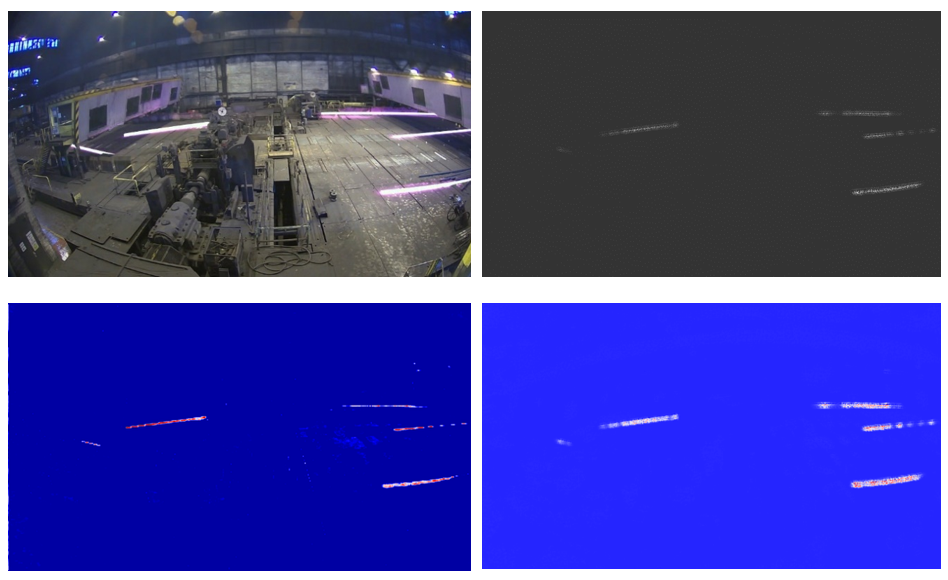
Figure: Visualization of the class „billet“ using Neuroscope: top left: original image, top right: saliency map, bottom left: guided Grad-CAM, bottom right: guided backpropagation.