TIA UX supports the digital twin by means of visual components presenting the generated data which is retrieved from, and processed within other TIA 4.0 components.
The purpose of TIA UX is to visualize the digital twin. TIA UX visualizes the historical, real time data as trend graphs, and status reports by means of different types of graphical elements. Both real-time and processed information that are used for condition monitoring and predictive maintenance of SWP are visualized by TIA UX.
Sample TIA UX components are presented in the following Figures.
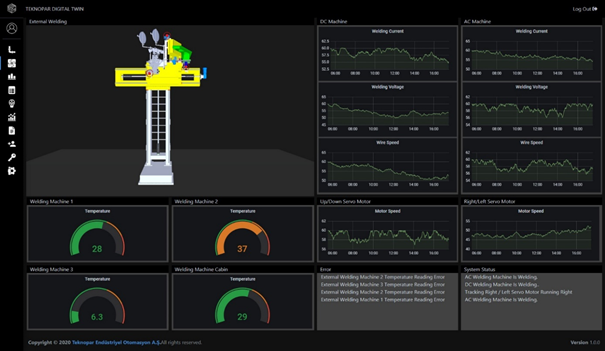
Figure 1- TIA UX Sample GUI for External Welding of SWP displaying Real-Time sensor Data
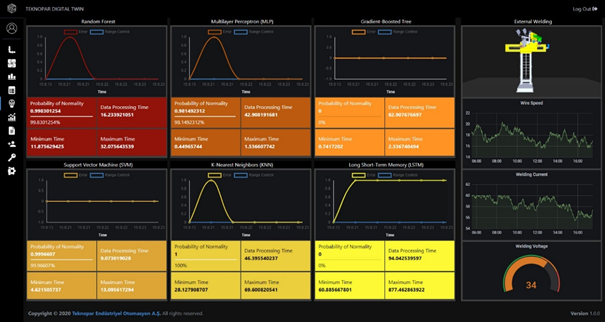
Figure 2- Real-Time ML Sample GUI visualized by TIA UX